
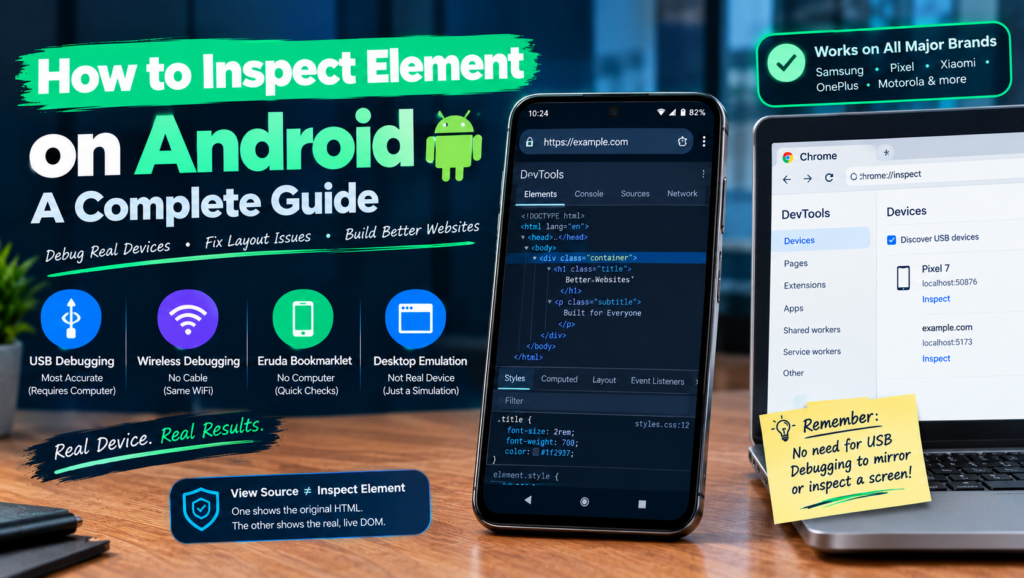
A layout that looks perfect on your desktop can fall apart the moment it loads on an actual phone, and no amount of resizing your browser window tells you why. Learning how to inspect element on Android matters for exactly this reason, since a phone brings its own browser engine version, real touch behavior, system fonts, and network conditions that a desktop simulation simply cannot reproduce. This guide covers genuine on device inspection methods using Chrome DevTools Android connections, a no computer option for quick checks on the go, and a clear explanation of a mistake several existing guides make: treating desktop emulation as if it were the same thing as inspecting a real device.
Fastest real device method: enable USB debugging on your phone, connect it to a computer, open chrome://inspect in desktop Chrome, and click inspect next to your phone’s open tab. This shows you the actual live page running on the actual device, not a simulation.
Table of Contents
Emulation vs a Real Device: A Distinction Worth Understanding First
This is genuinely the most important thing to understand before picking a method, and it is where a fair amount of existing content quietly misleads. Resizing your desktop Chrome window and choosing a device from the toolbar’s dropdown menu changes your viewport size and spoofs a mobile user agent string. It does not run your page on an actual phone. Real device inspection matters because only a genuine Android device shows you its specific browser engine version, real touch and tap behavior instead of mouse clicks, the system fonts actually installed on that phone, and real world network conditions, all of which can behave differently than what a desktop simulation shows you. Emulation is a fast, useful first check. It is not a substitute for the real thing.
Method 1: Inspect Element on Android Using Chrome DevTools Over USB
This is the most accurate method available, since it connects desktop Chrome DevTools directly to the live page running on your actual phone.
- On your Android phone, open Settings, then About phone, and tap Build number seven times to unlock Developer options.
- Go back to Settings, then System, then Developer options, and turn on USB debugging.
- Connect your phone to your computer with a USB cable.
- On your phone, accept the Allow USB debugging prompt that appears.
- On your computer, open Chrome and go to chrome://inspect in the address bar.
- Confirm Discover USB devices is checked, then find your phone listed with its open tabs underneath.
- Click inspect below the tab you want to debug, which opens a full DevTools window connected to that live page on your phone.
From here, the Elements panel works exactly like it does on desktop: click the inspector icon, tap an element on your phone’s screen, and its HTML and CSS appear instantly in DevTools on your computer, editable in real time.
Method 2: Wireless Debugging Without a Cable
This is a genuinely current convenience that older guides on this topic do not cover, and it works on Android 11 and up.
- Make sure your phone and computer are connected to the same WiFi network.
- In Developer options on your phone, turn on Wireless debugging.
- Tap Wireless debugging, then Pair device with pairing code, which displays a six digit code and an IP address with port number.
- On your computer, open chrome://inspect, click Configure, and add the IP address and port shown on your phone.
- Enter the pairing code when prompted to complete the connection.
Once paired, your phone’s open tabs appear in chrome://inspect exactly as they would over USB, just without the cable getting in the way.
Method 3: Inspecting Without a Computer at All
For a quick check while you are away from a desktop, a lightweight in browser tool called Eruda gives you a genuine inspector directly on your phone.
- Save a Eruda bookmarklet as a bookmark in your Android browser, following the exact code from Eruda’s own GitHub page.
- Open the webpage you want to inspect.
- Open your bookmarks and tap the saved Eruda bookmarklet, since Chrome blocks javascript based bookmarklets typed directly into the address bar.
- A small floating panel appears at the bottom of the screen, giving you access to Elements, Console, Network, and more, all without leaving your phone.
This will not replace full DevTools for serious debugging work, but it is genuinely useful for a fast look at a page’s structure when a computer is not nearby.
View Source vs Inspect Element: Not the Same Thing
This distinction trips people up regularly, and it matters more on mobile than it used to. View source shows you the raw HTML your server originally sent, before any JavaScript has touched the page. Inspect Element shows you the DOM, meaning the page exactly as it exists right now, after JavaScript has added, removed, or rearranged content. On a modern site built with a JavaScript framework, these two can look almost nothing alike, view source might return a nearly empty shell while the inspector shows a fully built out page. If you are trying to debug something that only appears after the page finishes loading or a user interacts with it, Inspect Element is the tool that actually shows you what is happening, not view source.
Inspecting a WebView Inside an Android App
This is a different situation from inspecting a normal browser tab, and it is worth knowing if you are developing an app rather than just a website. If your Android app displays web content through a WebView component, Chrome DevTools can only see and debug it if your app’s code specifically enables that access.
- In your app’s code, call setWebContentsDebuggingEnabled, typically inside the Activity or Application class where the WebView is set up
- It is worth wrapping this in a check so debugging is only enabled in development builds, not shipped to production
- Once enabled and your app is running on a connected device, the WebView appears in chrome://inspect the same way a browser tab does, usually labeled with your app’s package name
What You Can Actually Do Once You Are Connected
Once DevTools is connected to your phone, the same panels you already know from desktop debugging become available for the live mobile page.
- Elements panel: click any element to see and edit its HTML and CSS instantly, with changes reflected live on your phone’s screen
- Console: run JavaScript directly against the live page and see errors exactly as they occur on that specific device
- Network panel: watch real requests happen over your phone’s actual connection, useful for catching a slow or failed request that only shows up on mobile data
- Sources panel: set breakpoints and step through JavaScript execution exactly as it runs on the device
None of these panels behave any differently than they do on desktop once connected, which is exactly what makes real device inspection so valuable, you are debugging the actual page, not an approximation of it.
Comparing Your Options
| Method | Real device | Needs a computer | Best for |
| Chrome DevTools over USB | Yes | Yes | Serious debugging with the most accurate results |
| Wireless debugging | Yes | Yes, but no cable | The same accuracy as USB, with more freedom of movement |
| Eruda bookmarklet | Yes | No | A quick check while away from a desktop |
| Desktop Chrome or Firefox emulation | No, simulated only | Yes | A fast first look at responsive layout, not a substitute for the real thing |
Troubleshooting Common Problems
| Problem | Likely cause | Fix |
| Phone does not appear in chrome://inspect | USB debugging is off, or the cable does not support data transfer | Confirm USB debugging is enabled, and try a different cable known to support data |
| No authorization prompt appears on the phone | The prompt can be missed or dismissed accidentally | Unplug and reconnect the cable, then watch for the prompt immediately |
| Device connects on Windows but shows no tabs | Missing or outdated USB drivers | Install the correct OEM USB driver for your specific phone brand |
| Wireless pairing fails | Phone and computer are on different networks | Confirm both devices are connected to the exact same WiFi network |
Frequently Asked Questions
Can I inspect element on Android without a computer?
Yes, using a bookmarklet based tool like Eruda, which gives you a lightweight inspector directly in your phone’s browser. For serious debugging work, connecting to Chrome DevTools on a computer remains far more capable.
Is resizing my desktop browser the same as inspecting on a real Android device?
No. Resizing a desktop browser window only simulates the viewport size and spoofs a mobile user agent. It does not reflect the real device’s actual browser engine, touch behavior, fonts, or network conditions.
Do I need a USB cable to use Chrome DevTools with my phone?
Not necessarily. Wireless debugging, available on Android 11 and up, connects your phone to Chrome DevTools over the same WiFi network with no cable required.
Why doesn’t Chrome on Android have a built in inspect option like desktop Chrome?
Mobile Chrome does not include the full DevTools interface directly in the app. Instead, Google built remote debugging specifically so a mobile device connects to the full DevTools running on a desktop browser instead.
Conclusion
Knowing how to inspect element on Android comes down to choosing genuine on device inspection over desktop emulation whenever the accuracy actually matters. Chrome DevTools over USB or wireless debugging gives you the most complete and accurate picture, a bookmarklet tool like Eruda covers you when a computer is not available, and understanding the real difference between view source and true DOM inspection will save you real confusion on modern, JavaScript heavy sites. Once you have connected to a real device the first time, the whole process takes under a minute for every debugging session after that.